
Getting Started with RepoDB Insights Default Telemetry
RepoDB Insights is the companion solution for RepoDB’s Telemetry feature — a six-container stack that receives, stores, and visualizes the operation-level telemetry your application emits. This post walks through standing it up locally: what docker compose up actually does, how to wire an application into it, and what each of the six images is responsible for.
Visit our announcement at RepoDB Default Telemetry for your App and Services Data Insights to understand more about this feature.
✅️ Running the default setup will enable your telemetry insights in a minute.
Everything is defined in docker-compose.yml and .env files. Download these files to any directory. Then execute the docker compose command below.
docker compose up -d
Successful installation will be like below.
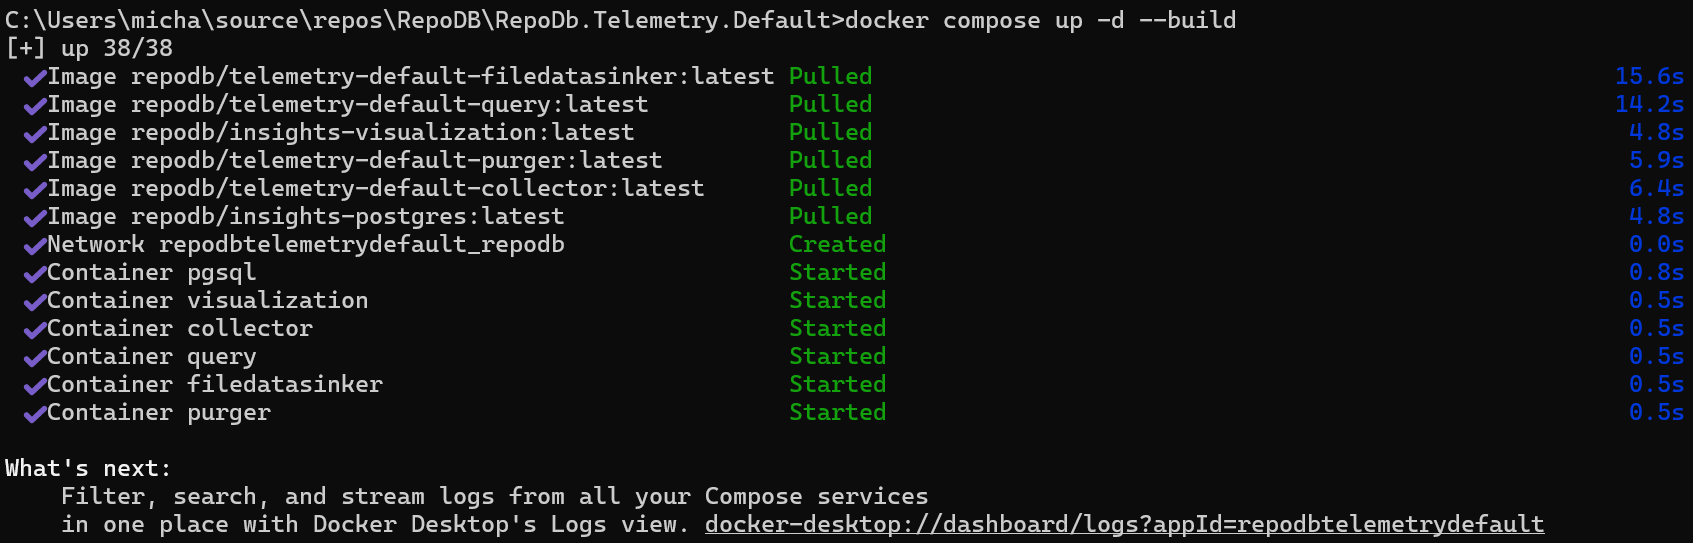
Everything ships with local defaults (RepoDB2026 as the shared password/API key) meant for trying things out, not production. Override them via a .env file next to docker-compose.yml.
✅ Then, you can directly jump to Integrating your application section to integrate your application.
That’s it, you are done! 💯
To customize your own compose, follow the steps below!
Configure your PostgreSQL
By default, RepoDB Insights PGSQL is shipped with RepoDB2026 as the default password. To change it, update the settings of pgsql section from the YML file as seen below.
pgsql:
    image: repodb/insights-postgres:latest
    container_name: pgsql
    environment:
      POSTGRES_PASSWORD: <YOU_CUSTOM_PGSQL_PASSWORD>
A database named repodb_insights is created by default. It ships with a table named DefaultTelemetry.
Configure your File Data Sinker
By default, the file data sinker is responsible for sinking your telemetry data into a data file, located at /tmp/repodb/telemetry.
Ensure that this is mounted in your environment to make it durable.
Sinking happens every hour and sinks the latest published telemetry data based on the last replicated data. The pointer uses the StartTime column, which maps the information about when the telemetry was sent.
To change the settings, go to the filedatasinker section and update the settings below. Make sure to also update the PGSQL password.
filedatasinker:
    image: repodb/telemetry-default-filedatasinker:latest
    container_name: filedatasinker
    cpus: 0.25
    environment:
      CONNECTION_STRING: postgresql://postgres:<YOU_CUSTOM_PGSQL_PASSWORD>@pgsql:5432/repodb_insights
      DIRECTORY_PATH: <YOUR_CUSTOM_DIRECTORY_PATH>
      FREQUENCY_IN_MINUTES: 60
    volumes:
      - telemetry_data:<YOUR_CUSTOM_DIRECTORY_PATH>
Configure your Purger
By default, the purger is deleting the expired rows (> 1 week) from the PGSQL. This is to ensure that your PGSQL performs at its best as many clients publish metrics to this database. It does the check every 5 minutes.
To change the settings, go to the purger section and update the settings below. Make sure to also update the PGSQL password.
purger:
    image: repodb/telemetry-default-purger:latest
    container_name: purger
    cpus: 0.25
    environment:
      CONNECTION_STRING: postgresql://postgres:<YOU_CUSTOM_PGSQL_PASSWORD>@pgsql:5432/repodb_insights
      RETENTION_PERIOD_IN_MINUTES: 10080
      FREQUENCY_IN_MINUTES: 5
Configure your Collector API
⚠️ This is where your application sends the captured telemetry data.
By default, the collector API is shipped with RepoDB2026 as the default API key and is running on port 5000. These settings can be changed as this information is necessary during the startup of your client application.
To change the settings, go to the collector section and update the settings below. Make sure to update the PGSQL connection string.
collector:
    image: repodb/telemetry-default-collector:latest
    container_name: collector
    environment:
      API_KEY: <YOUR_CUSTOM_API_KEY>
      CONNECTION_STRING: postgresql://postgres:<YOU_CUSTOM_PGSQL_PASSWORD>@pgsql:5432/repodb_insights
The API docs can be found at http://localhost:5000/docs after docker compose.
Configure your Query API
By default, the query API is shipped with RepoDB2026 as the default API key and is running on port 5001. Change this and update your Grafana visualization to connect here.
To change the settings, go to the query section and update the settings below. Make sure to update the PGSQL connection string.
query:
    image: repodb/telemetry-default-query:latest
    container_name: query
    environment:
      API_KEY: <YOUR_CUSTOM_API_KEY>
      DIRECTORY_PATH: <YOUR_CUSTOM_DIRECTORY_PATH>
      CONNECTION_STRING: postgresql://postgres:<YOU_CUSTOM_PGSQL_PASSWORD>@pgsql:5432/repodb_insights
    volumes:
      - telemetry_data:<YOUR_CUSTOM_DIRECTORY_PATH>
The API docs can be found at http://localhost:5001/docs after docker compose.
Querying the operational endpoint http://localhost:5001/v1/telemetry/default/operational/query returns a result structured like the one below.
{
  "success": true,
  "elapsed": 0.013759000000007404,
  "timestamp": "2026-07-18T07:00:46.862435",
  "data": [
    {
      "Group": "Analytics",
      "Application": "CampaignManager",
      "SessionId": "1b1804e7-d60a-45d3-8c11-7f24d101188f",
      "Operation": "QueryAll",
      "StartTime": "2026-07-18T06:54:00.840664",
      "Statement": "SELECT * FROM \"Suppliers\";",
      "Elapsed": 278.06,
      "IsCancelled": false,
      "Client": "DesktopApp",
      "Source": "SqlServer-Primary",
      "Version": "1.0.0",
      "CreatedAt": "2026-07-18T06:59:26.261483",
      "UpdatedAt": "2026-07-18T06:59:26.261483"
    },
    {
      "Group": "Analytics",
      "Application": "CampaignManager",
      "SessionId": "cdcf4334-a145-4029-8de8-bf90a1c22692",
      "Operation": "BulkInsert",
      "StartTime": "2026-07-18T06:38:31.177942",
      "Statement": "INSERT INTO \"Warehouses\" (\"Name\", \"CreatedAt\") SELECT * FROM UNNEST(@Names, @CreatedAts);",
      "Elapsed": 194.52,
      "IsCancelled": false,
      "Client": "AdminConsole",
      "Source": "MySql-Cluster",
      "Version": "1.0.0",
      "CreatedAt": "2026-07-18T06:59:26.261483",
      "UpdatedAt": "2026-07-18T06:59:26.261483"
    }
  ]
}
It is also important to take note that the historical endpoint is provided to extract all the historical captured telemetry data from the data files (sinked by file data sinker component).
Configure your Grafana Visualization
By default, the Grafana Visualization component is shipped with RepoDB2026 as the default admin password. It also ships the default company name Your Company Name with the RepoDB logo.
To change the settings, go to the visualization section and update the settings below. Make sure to also update the PGSQL password.
visualization:
    image: repodb/insights-visualization:latest
    container_name: visualization
    environment:
      GF_SECURITY_ADMIN_PASSWORD: <YOUR_CUSTOM_ADMIN_PASSWORD>
      REPODB_PG_PASSWORD: <YOU_CUSTOM_PGSQL_PASSWORD>
      REPODB_COMPANY_NAME: <YOUR_COMPANY_NAME>
      REPODB_COMPANY_LOGO: <YOUR_COMPANY_LOGO_PUBLIC_LINK>
      REPODB_API_KEY: <YOUR_QUERY_API_KEY>
The visualization can be found at http://localhost:3000 after docker compose.
Integrating your application
Install the package and wire it up once at startup, pointing host at your running Collector API. Usually it is on http://localhost:5000:
> Install-Package RepoDb.Telemetry.Default
GlobalConfiguration
    .Setup(new GlobalConfigurationOptions { UseRegisteredGlobalTraces = true })
    .UseDefaultTelemetry(
        host: "http://localhost:5000",
        apiKey: "RepoDB2026",
        applicationName: "<YOUR_APPLICATION_NAME>",
        groupName: "<YOUR_APPLICATION_GROUP>");
What happens behind the scenes: this feature is built on top of RepoDB’s Tracing pipeline. UseDefaultTelemetry registers a TelemetryTrace that implements ITrace and hooks into every operation’s BeforeExecution()/AfterExecution() lifecycle — Insert, Query, Update, Delete, and the rest — across every connection in the process, with no custom ITrace implementation required on your end. Each execution is captured as a TelemetryItem (statement, elapsed time, session, client, source assembly, cancellation state) and buffered in memory.
On an interval (defaulting to 5 seconds), the buffer is gzip-compressed, base64-encoded, and POSTed as a single batch to the Collector API’s /v1/telemetry/default/publish endpoint, tagged with the applicationName and groupName you configured. Nothing blocks your application’s actual database calls — publishing happens off to the side.
Once you are done with everything, run docker compose up -d and everything will be up and running in a minute.
🎉 Congratulations on following this tutorial! 🎓
Connecting from .NET
Any Postgres client works, but here’s a RepoDB-native example that queries the table directly — useful for ad hoc checks against the running container:
using System;
using Npgsql;
using RepoDb;

// One-time, at app startup — tells RepoDB how to talk to PostgreSQL
GlobalConfiguration
    .Setup()
    .UsePostgreSql();

var connectionString =
    "Host=localhost;Port=5432;Database=repodb_insights;Username=postgres;Password=RepoDB2026";

using var connection = new NpgsqlConnection(connectionString);

var recent = connection.Query<DefaultTelemetry>(
    where: e => e.Group == "Default" && e.StartTime >= DateTime.UtcNow.AddHours(-1),
    orderBy: OrderField.Parse(new { StartTime = Order.Descending }),
    top: 50);

foreach (var row in recent)
{
    Console.WriteLine($"{row.StartTime:u}  {row.Application,-20} {row.Operation,-10} {row.Elapsed,8:N2} ms");
}

[Map("DefaultTelemetry")]
public class DefaultTelemetry
{
    public string Group { get; set; }
    public string Application { get; set; }
    public string SessionId { get; set; }
    public string Operation { get; set; }
    public DateTime StartTime { get; set; }
    public string Statement { get; set; }
    public double Elapsed { get; set; }
    public bool IsCancelled { get; set; }
    public string Client { get; set; }
    public string Source { get; set; }
    public string Version { get; set; }
    public DateTime CreatedAt { get; set; }
    public DateTime UpdatedAt { get; set; }
}
Custom trace key
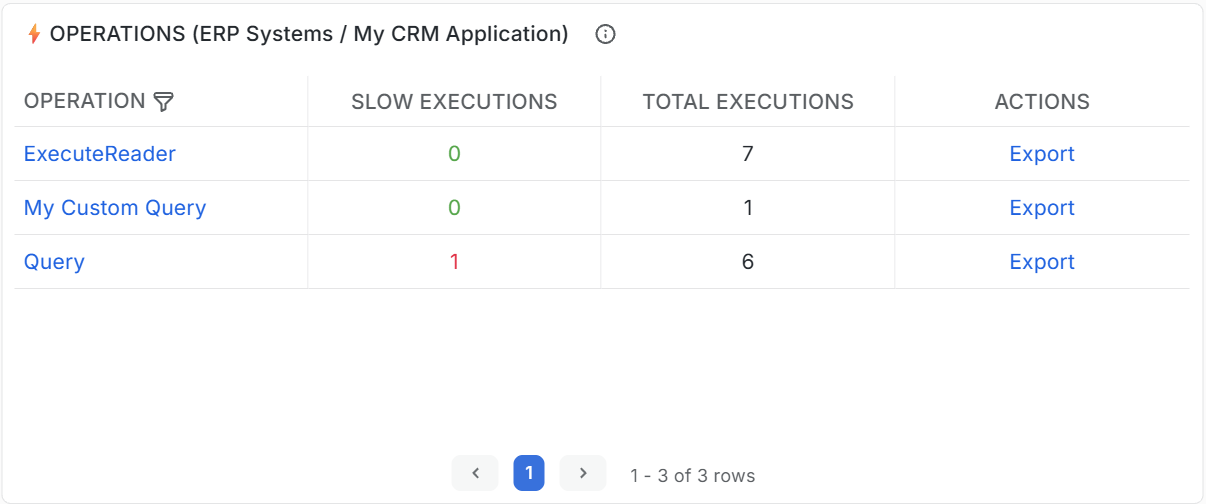
The insights are also capturing the customized traceKey you provided when you execute the method. It is present to all operations of the library.
var connectionString =
    "Host=localhost;Port=5432;Database=repodb_insights;Username=postgres;Password=RepoDB2026";

using var connection = new NpgsqlConnection(connectionString);

var recent = connection.Query<DefaultTelemetry>(
    where: e => e.Group == "Default" && e.StartTime >= DateTime.UtcNow.AddHours(-1),
    orderBy: OrderField.Parse(new { StartTime = Order.Descending }),
    top: 50,
    traceKey: "My Custom Query"); // Custom trace key (existing in the older version of RepoDB)
And it will be captured as below.
Closing notes
That’s the full loop: an app traces its own operations via RepoDb.Telemetry.Default, ships them to the Collector, Postgres holds the operational window, the Purger and FileDataSinker keep that window bounded while archiving the rest to Parquet, the Query API serves both sources back out, and Grafana turns it into dashboards — all six pieces started with one docker compose up -d.
If you’re already running RepoDB in production, turning this on costs one Install-Package and a four-line GlobalConfiguration.Setup() call — everything else is infrastructure you don’t have to build yourself. Give the stack a spin locally, and let us know what you’d want to see next on the dashboards.
- GitHub: RepoDB.Default.Telemetry
- Docs: repodb.net/tutorial/get-started-telemetry
- NuGet: RepoDb.Telemetry.Default
Please support us
Give a ⭐ to our GitHub repository |
Follow me at X / Twitter |
Connect with us at our official Teams Channel
Apache License 2.0 — Copyright © 2026 by Michael Camara Pendon / Create a Request