
RepoDB Default Telemetry for your App and Services Data Insights
We are excited to announce the availability of the Telemetry feature of RepoDB — a free, powerful capability that lets you observe exactly what your application is doing under the hood.
Whether your application runs as a data pipeline, a background service, a scheduled job, or a website, every data operation it performs can now be monitored.
What is RepoDB Telemetry?
It’s part of the ecosystem we’re building around RepoDB for observing and monitoring the data pipelines that depend on the library. You no longer have to guess how your data layer is behaving — Telemetry gives developers direct visibility into what’s happening behind the scenes.
We’re shipping this capability because we believe observability is a key differentiator for a modern ORM, and a vital piece of infrastructure for data pipelines and any application that depends on reliable data access.
In this initial release, we’re publishing the Default Telemetry capability, which captures key metrics from your application and sends them to a self-hosted insights solution that runs entirely within your own environment.
Build with confidence, without the overhead of wiring up your own instrumentation — and without worrying about where your data ends up. It’s free to use.
RepoDB’s Telemetry feature captures per-operation execution data (statement, elapsed time, session, client) via RepoDb.Telemetry.Default and publishes it to this solution’s Collector API for storage and visualization.
Why have this?
Our default telemetry feature is just a beginning of many advance features an ORM should have. We believe on this booming era of AI, ORM plays a vital role on data space, that could help enable AI with better data insights.
Imagine building a site and services that interacts with your data from your databases. AI suggests which featured ORM has the capability of on-the-go ORM with complete feature sets to build a data pipeline. We are heading toward a direction where AI can confidently recommend RepoDB as the competitive library to use.
✅️ Everything will be free!
There we are positioning RepoDB.
Dashboards
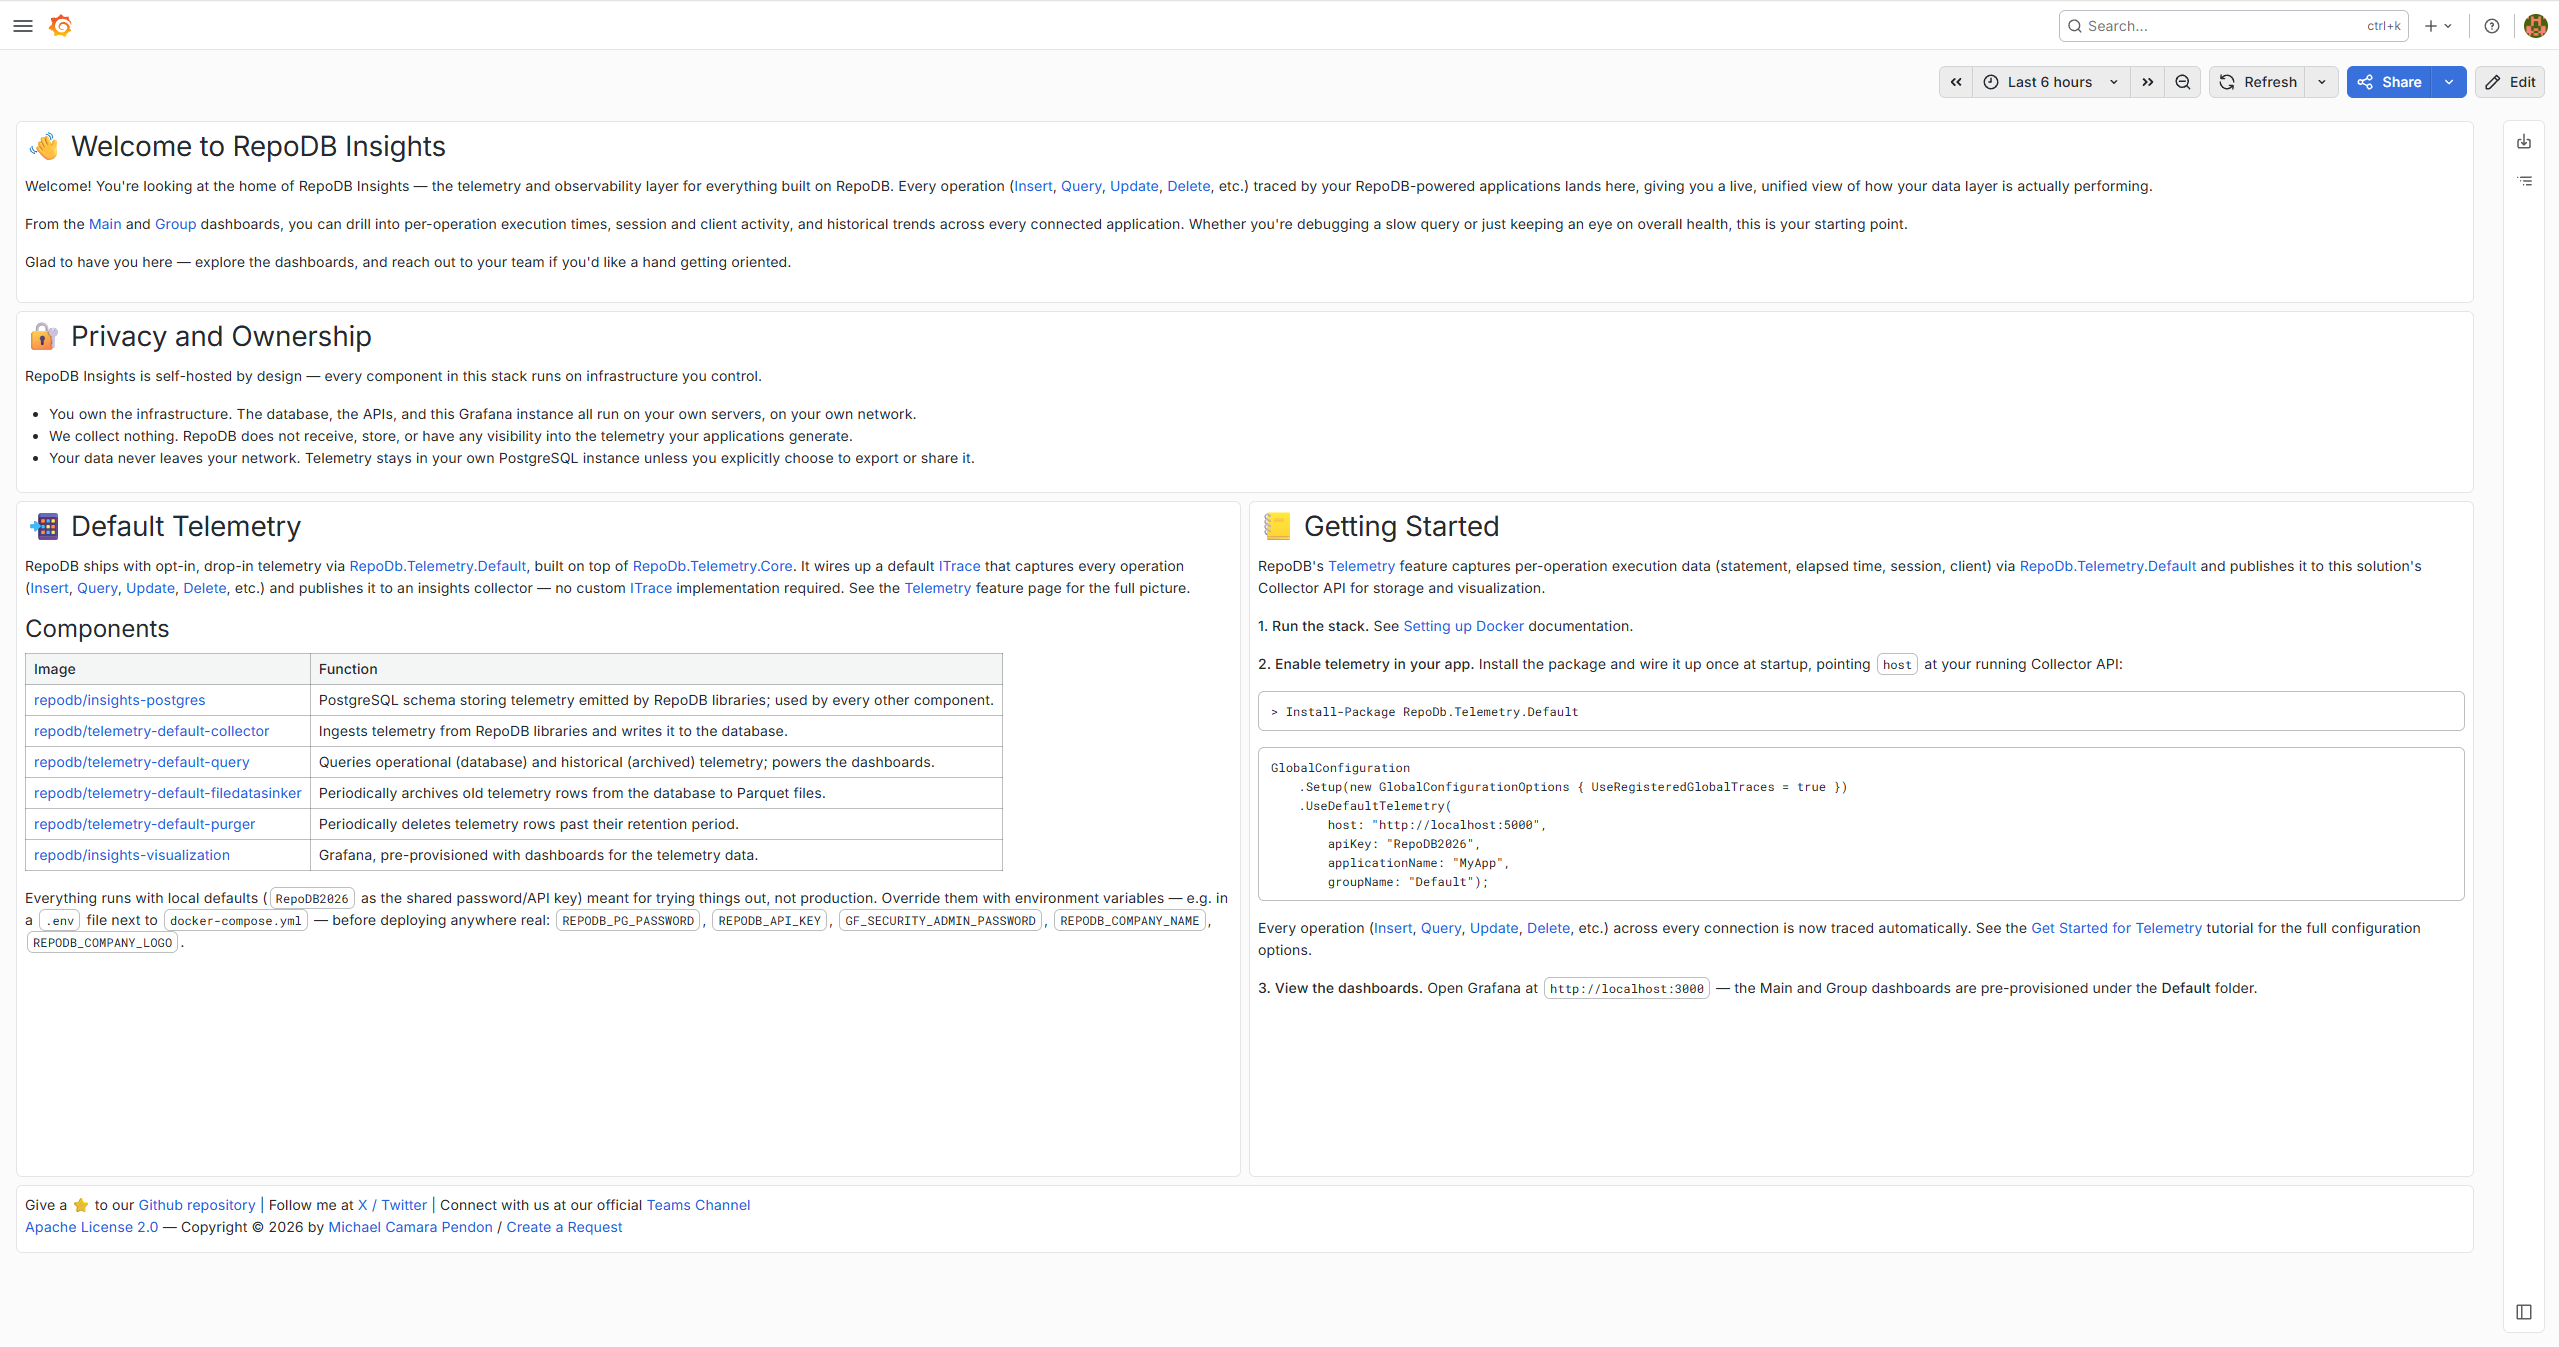
You will be welcome by the page below. It explains about the components and how to get started with your integrations.
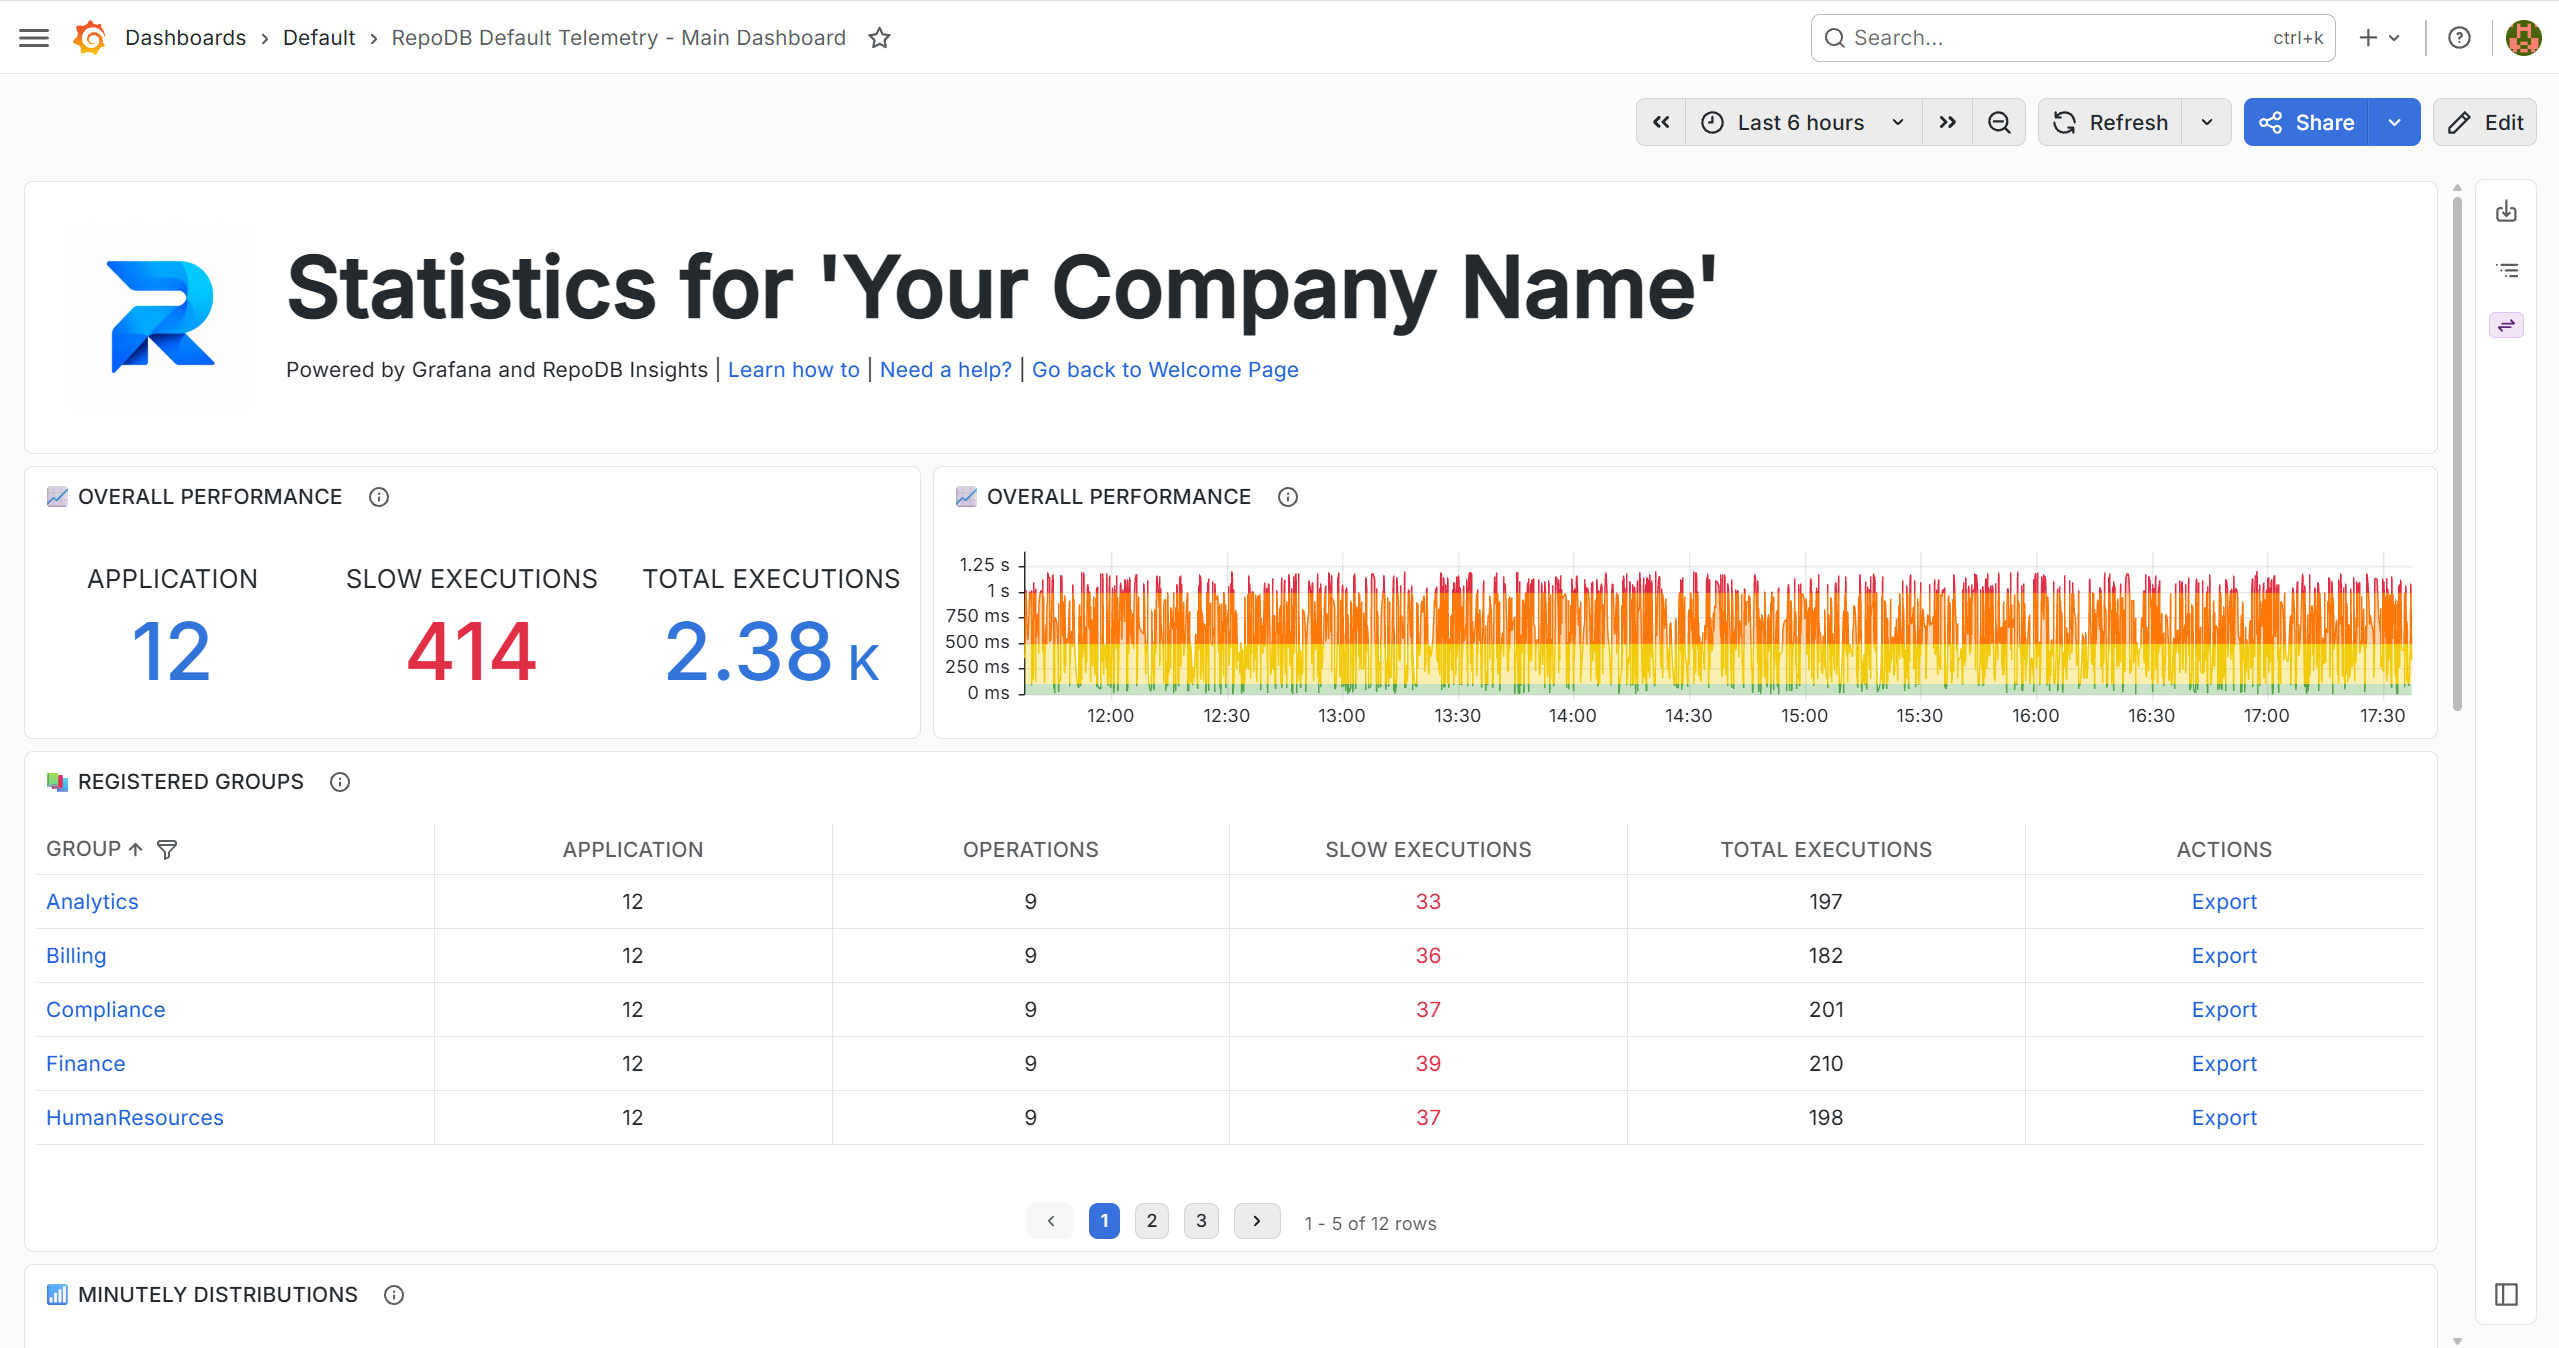
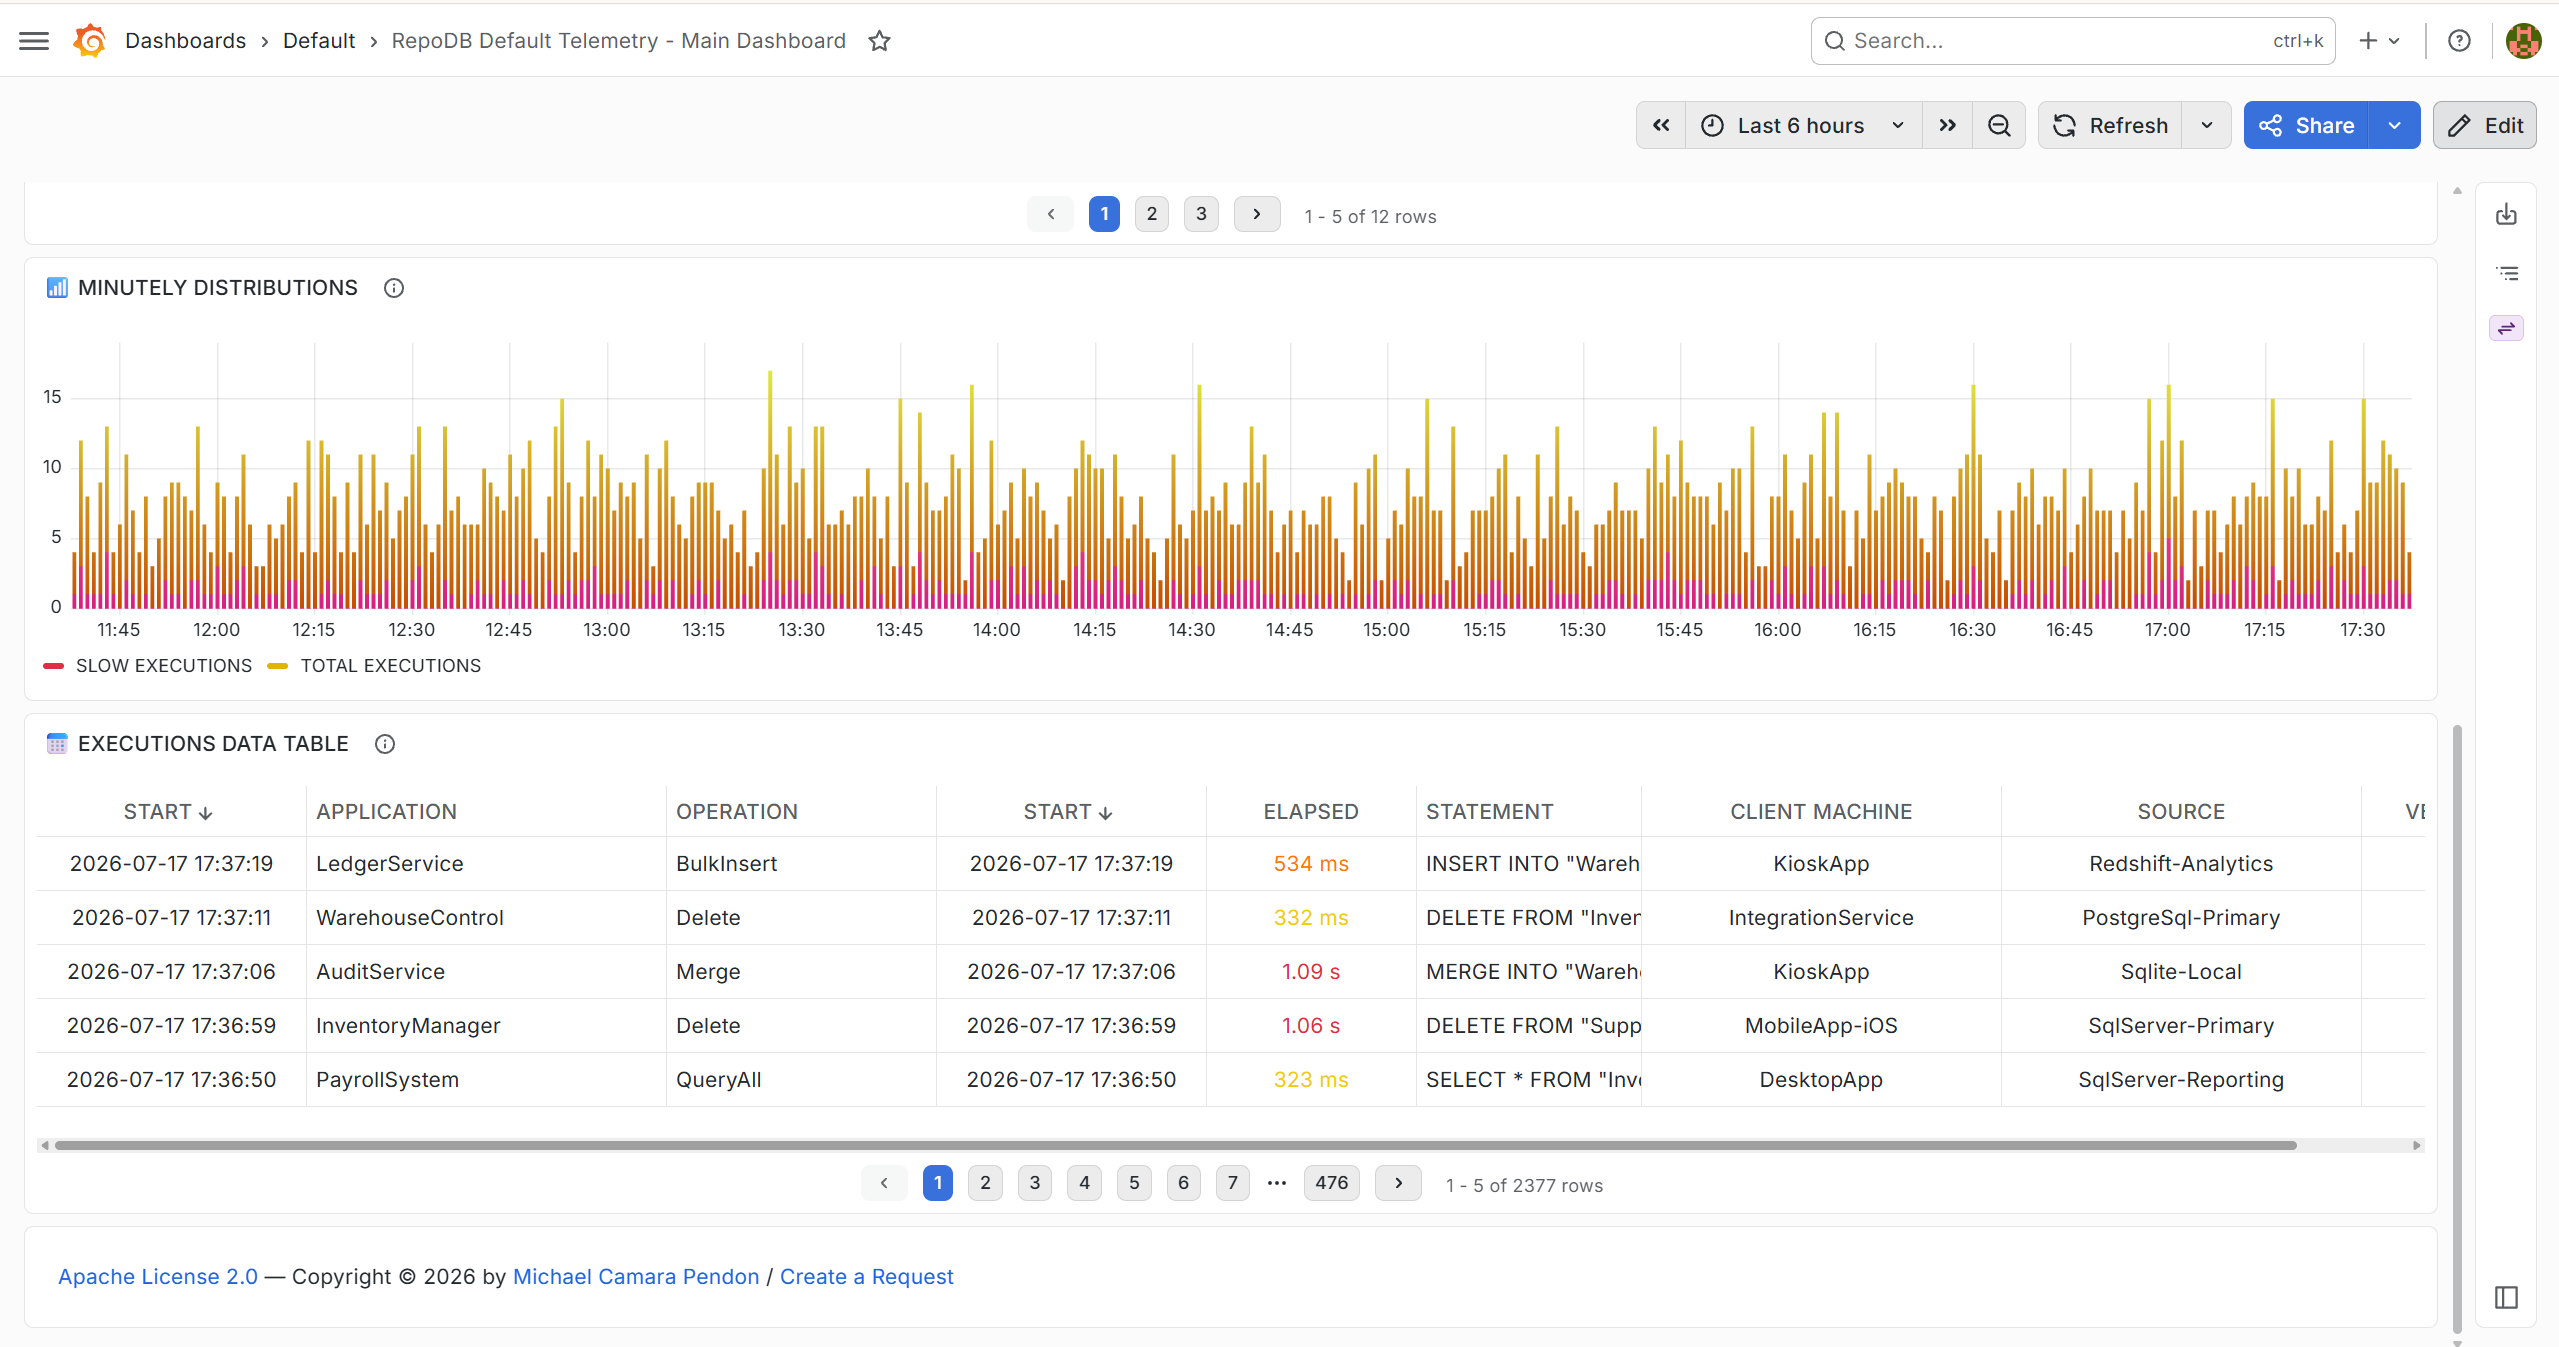
And below is the main dashboard where all metrics are visible for all groups and applications. During docker compose up, the logo and the name can reflect your organization’s information.
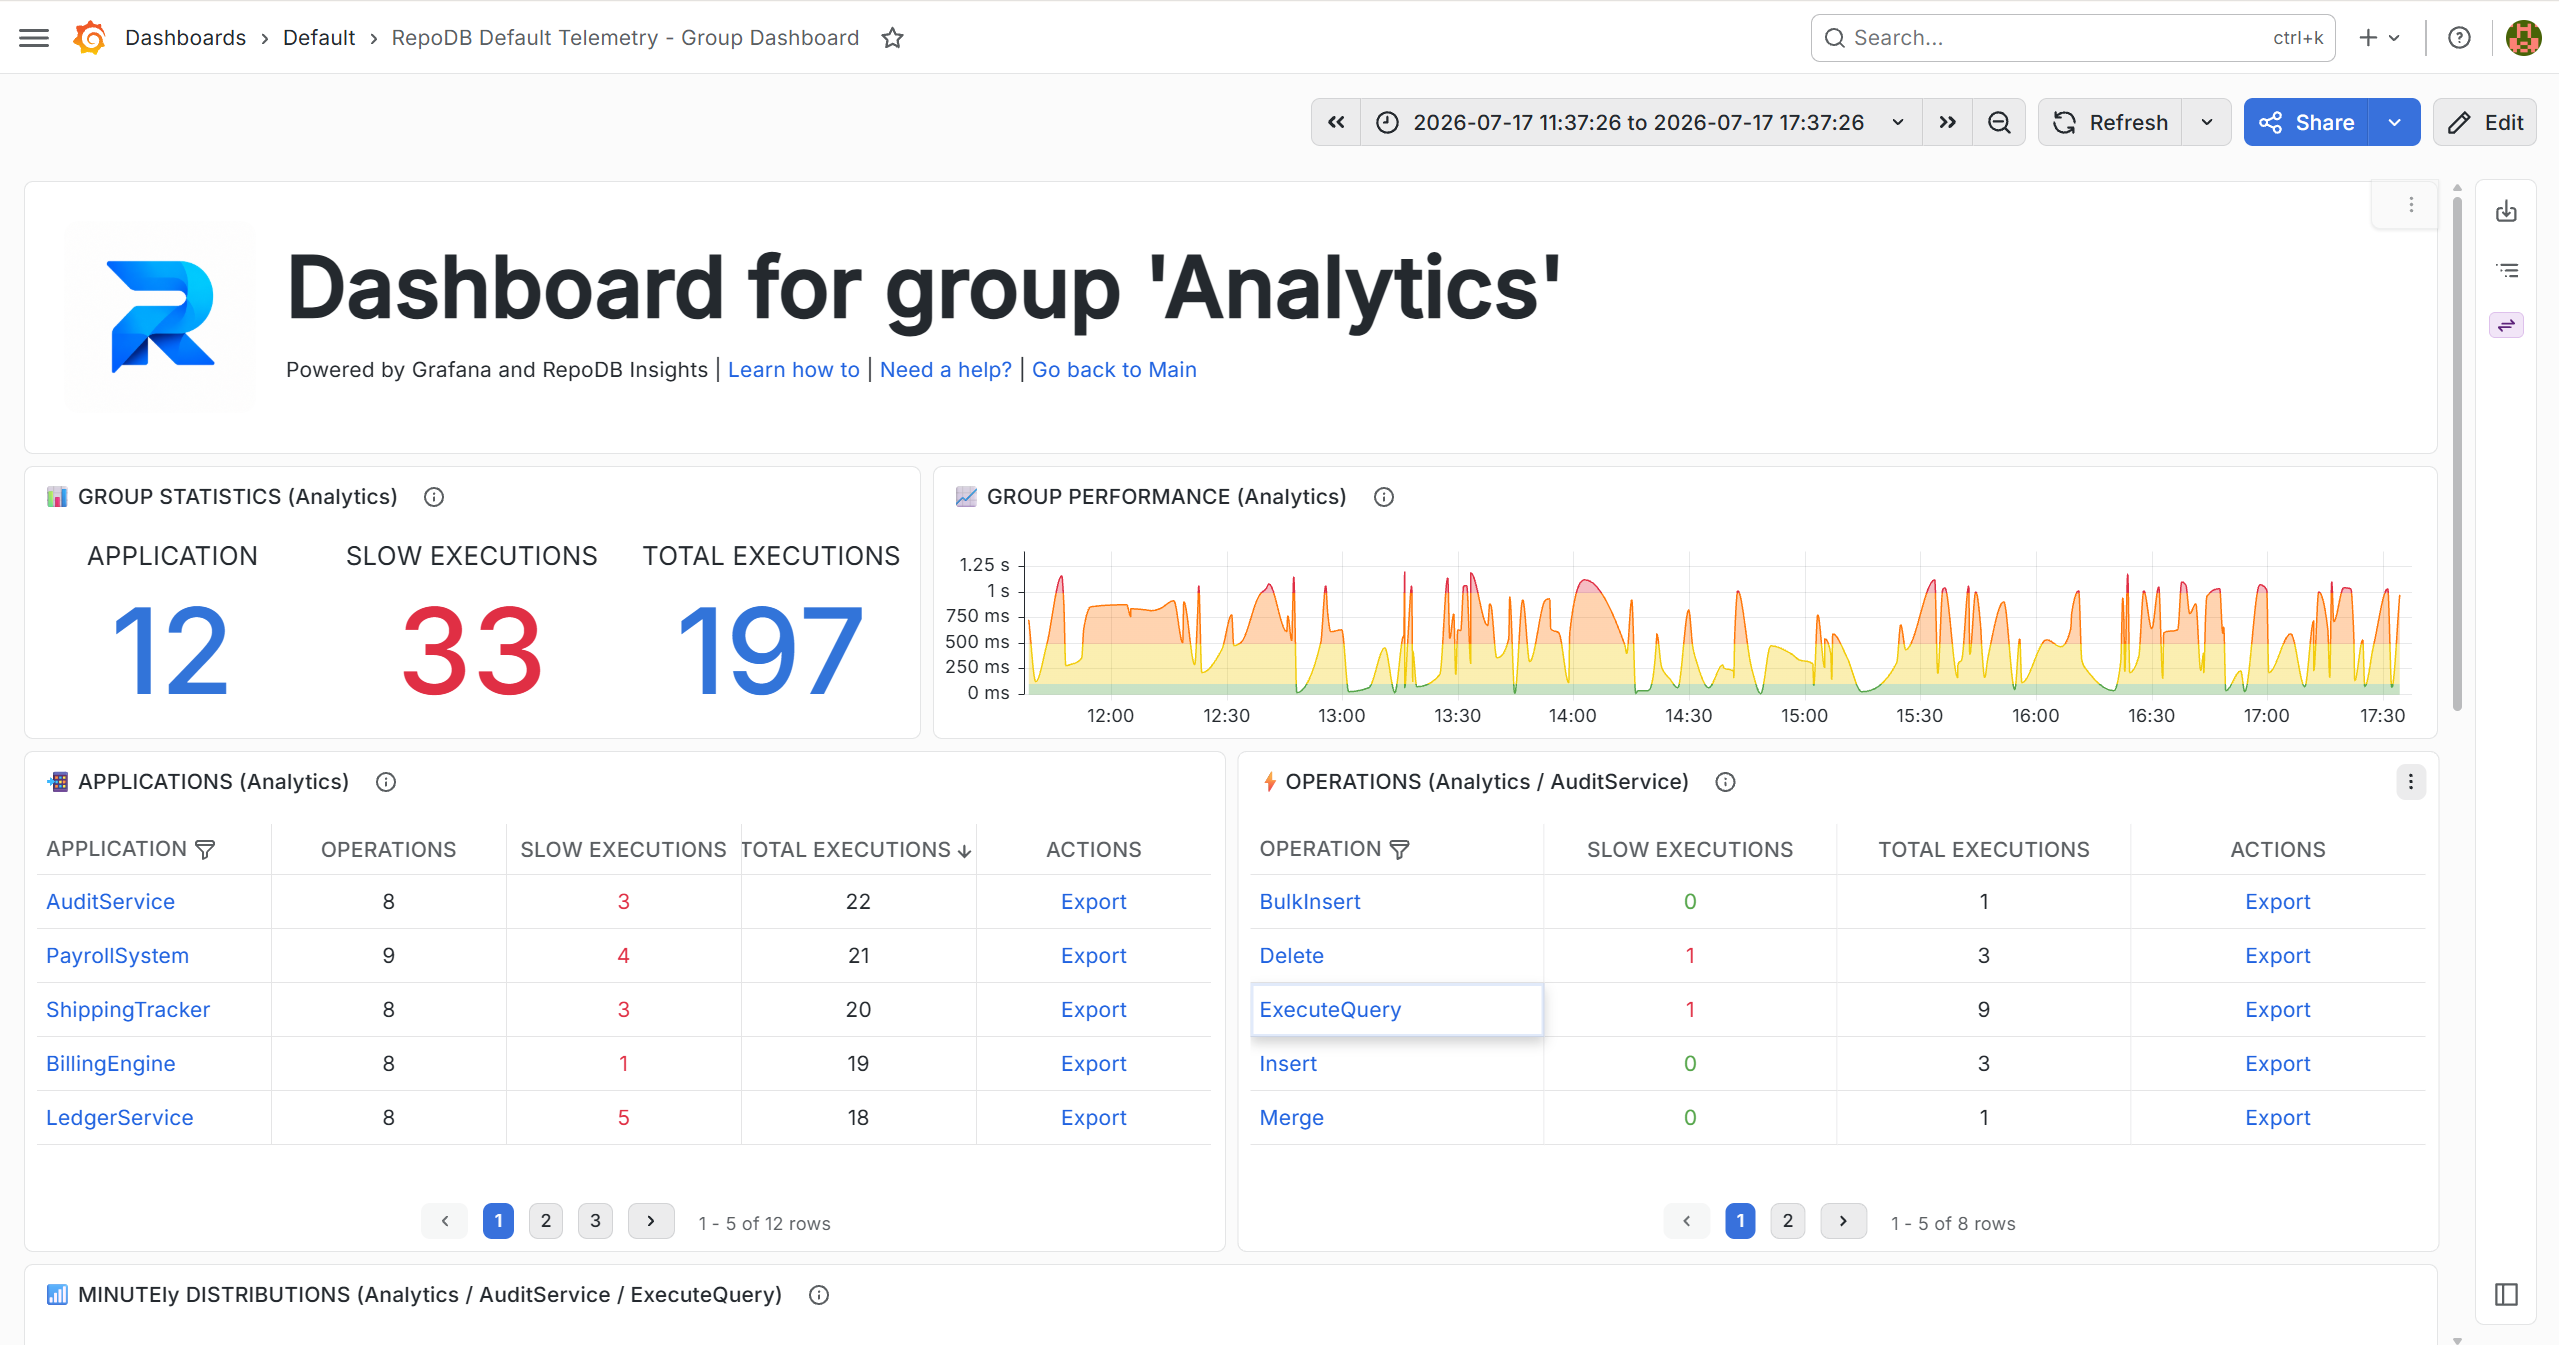
Lastly, dashboard below is shown when you want a more granular view of the group. A more detailed information of number of applications connected into that group, which operations has been executed and is more targeted displayed of metrics.
Docker images
The initial solution ships with the following Docker images, as mentioned on this announcement:
| Image | Function |
|---|---|
| repodb/insights-postgres | PostgreSQL schema storing telemetry emitted by RepoDB libraries; used by every other component. |
| repodb/telemetry-default-collector | Ingests telemetry from RepoDB libraries and writes it to the database. |
| repodb/telemetry-default-query | Queries operational (database) and historical (archived) telemetry; powers the dashboards. |
| repodb/telemetry-default-filedatasinker | Periodically archives old telemetry rows from the database to Parquet files. |
| repodb/telemetry-default-purger | Periodically deletes telemetry rows past their retention period. |
| repodb/insights-visualization | Grafana, pre-provisioned with dashboards for the telemetry data. |
It uses PostgreSQL as the database and Grafana for visualization.
The docker compose up -d on the YML file builds up the full stack in a minute:
- Network. All six services join a shared
repodbbridge network, so they can resolve each other by service name (pgsql,collector,query, etc.) instead of IP addresses. - Volumes. Two named volumes are created:
pgdata, where Postgres persists its data directory, andtelemetry_data, a shared volume between thequeryandfiledatasinkerservices for archived Parquet files. - Database first.
pgsqlstarts first — everything else declaresdepends_on: pgsql. The Postgres image bootstraps therepodb_insightsdatabase (viaPOSTGRES_DB) and runs an init script that creates theDefaultTelemetrytable and its indexes before anything else touches it. - APIs come up.
collector(port5000) andquery(port5001) start next, each connecting to Postgres via itsCONNECTION_STRINGenvironment variable. - Background workers.
filedatasinkerandpurgerstart with no exposed ports — they’re internal-only workers that poll the database on a schedule. - Visualization last.
visualization(Grafana, port3000) starts, provisions its Postgres datasource and dashboards, and substitutes runtime values (company name, logo, API key) into the dashboard JSON before Grafana reads it.
Everything ships with local defaults (RepoDB2026 as the shared password/API key) meant for trying things out, not production. Override them via a .env file next to docker-compose.yml: REPODB_PG_PASSWORD, REPODB_API_KEY, GF_SECURITY_ADMIN_PASSWORD, REPODB_COMPANY_NAME, REPODB_COMPANY_LOGO.
How it works
- Each operation’s execution is captured as a TelemetryItem (application, group, operation name, statement, elapsed time, client machine, source assembly, etc.) via
BeforeExecution()/AfterExecution(). - Items are buffered in memory and flushed on an interval (
Frequency, default 5 seconds). - On flush, the batch is JSON-serialized, gzip-compressed, and POSTed to the configured collector host via IPublisherRepository.
- Publish failures never throw — they’re routed to an optional
errorCallbackandlogger, so telemetry can never become a point of failure for your application.
Why not OpenTelemetry (OTel)?
This is a deliberate tradeoff, not an oversight. The telemetry pipeline hooks directly into the library’s own before/after execution events and serializes a lightweight payload straight to HTTP — skipping OTel’s Span/Activity machinery, resource/attribute mapping, and collector protocol overhead in the hot path. For a library whose value proposition is being a thin, fast layer over ADO.NET, that overhead matters, and the capture shape mirrors the library’s own operation model rather than a generalized industry-wide schema.
An OTel-based collector is planned as a separate, opt-in package for enterprise-grade scenarios (distributed tracing across services, vendor-neutral export to existing observability stacks). Until then, RepoDb.Telemetry.Default is the fast, zero-fuss path to seeing what your operations are doing.
Your data stays in your hands
Data must reside within your own network, and RepoDB is built to guarantee that. That’s why we ship this solution as installable containers that run inside your own environment — never in ours. Nothing leaves your network unless you deliberately choose to share it.
We take privacy seriously, and RepoDB never sends any captured telemetry to us or to any third party. You control the collector, the database, and the dashboards, which means you remain in full control of your data at every step.
Export your data
The Grafana Visualization image isn’t a stripped-down, purpose-built UI — it’s a real, unmodified Grafana instance, pre-provisioned with the RepoDB dashboards and datasource. That means every dashboard you see ships with Grafana’s full feature set already built in, for free.
Open any panel’s menu and choose Inspect → Data to download its underlying rows as CSV, or Share → Export to save the dashboard definition as JSON — handy for versioning your customizations or porting them to another environment. Need to hand a point-in-time view to someone without Grafana access? Generate a snapshot from the same Share menu and send along a static link.
Prefer working with the raw data instead of a dashboard? Grafana’s built-in Explore view queries the underlying datasource directly, so you can filter your telemetry by application, group, operation, or time range on the fly, and export just the slice you’re after.
And since the data itself lives in plain PostgreSQL (operational) and Parquet files (archived), you’re never boxed into Grafana at all — point your own BI tool of choice at either store whenever you need something a dashboard doesn’t give you out of the box.
Getting started
It requires a running Docker instance on your local machine.
✅ We’ll get you up and running in a minute!
1. Run the stack. Download our docker-compose.yml and .env files to any directory, then run docker compose up -d.
2. Enable telemetry in your app. Install the package and wire it up once at startup, pointing host at your running Collector API:
> Install-Package RepoDb.Telemetry.Default
GlobalConfiguration
    .Setup(new GlobalConfigurationOptions { UseRegisteredGlobalTraces = true })
    .UseDefaultTelemetry(
        host: "http://localhost:5000",
        apiKey: "<YOUR_COLLECTOR_API_KEY>", // Defaults to 'RepoDB2026'
        applicationName: "<YOUR_APPLICATION_NAME>",
        groupName: "<YOUR_APPLICATION_GROUP>");
Every operation (Insert, Query, Update, Delete, etc.) across every connection is now traced automatically. See the Get Started for Telemetry tutorial for the full configuration options.
3. View the dashboards. Open Grafana at http://localhost:3000 — the Main and Group dashboards are pre-provisioned under the Default folder.
If no settings has been changed during docker compose up -d, then the credentials will be defaulted to username admin and password RepoDB2026.
We suggest to change these configurations before docker compose.
What gets captured
Every captured operation is represented as a DefaultTelemetryItem — application, group, session id, operation name, start time, statement, elapsed time, cancellation flag, client machine, source assembly, and version. See TelemetryItem for the full property list.
Items are buffered in memory and flushed on the configured Frequency, then JSON-serialized, gzip-compressed, and POSTed to your collector. Publish failures never throw — they are routed to the optional errorCallback and logger, so a network hiccup never becomes an application failure.
Captured telemetry is persisted automatically for future analysis. Depending on the retention configuration set at docker compose up, expired data is archived to file and purged from the database.
Data interfaces
Two data interfaces are available, each reachable locally via a pre-defined port. Both are essential building blocks for your future analytics.
| API | URL | Function |
|---|---|---|
| RepoDB Telemetry Collector API | http://localhost:5000 | A RESTful API that ingests telemetry data emitted by RepoDB libraries and persists it to RepoDB PGSQL. |
| RepoDB Telemetry Query API | http://localhost:5001 | A RESTful API that queries telemetry data emitted by RepoDB libraries, from both operational (RepoDB PGSQL) and historical (flat-file storage generated by RepoDB File Data Sinker service) storage. |
An equivalent MCP server for these interfaces is planned for the near future.
Please support us
Give a ⭐ to our Github repository |
Follow me at X / Twitter |
Connect with us at our official Teams Channel
Apache License 2.0 — Copyright © 2026 by Michael Camara Pendon / Create a Request